Commentary using these figures appeared at Tokyo Review.

The moving average includes data from surveys conducted by JNN, ANN, NHK, Jiji, Kyodo, Mainichi, Asahi, Yomiuri, FNN (Sankei), and Nikkei news organizations.
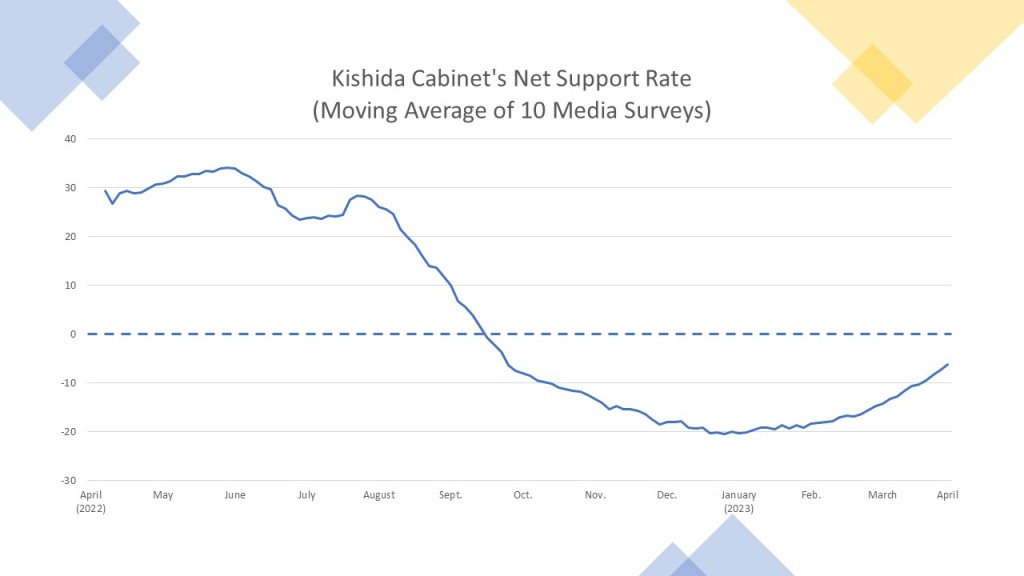
Note: The moving average includes data from surveys conducted by JNN, ANN, NHK, Jiji, Kyodo, Mainichi, Asahi, Yomiuri, FNN (Sankei), and Nikkei news organizations. Calculated by subtracting the percentage of respondents who support the cabinet from those who explicitly said they did not support the cabinet.
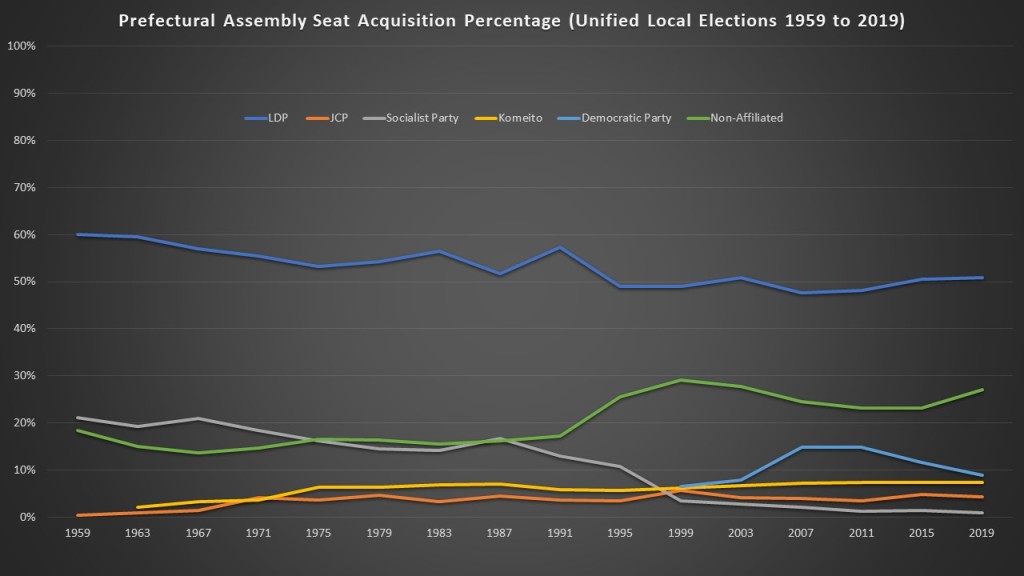
Note: The LDP only contested its first ULE as a merged party in 1959. Socialist Party trend line includes both the performance of the Japan Socialist Party and its successor, the Socialist Democratic Party. The Democratic Party trend line includes both the DPJ and CDPJ incarnations.

Note: Pink= 1-9 candidates; Yellow=10-19 candidates; Orange=20+ candidates. Grey is no candidates or no prefectural assembly held.
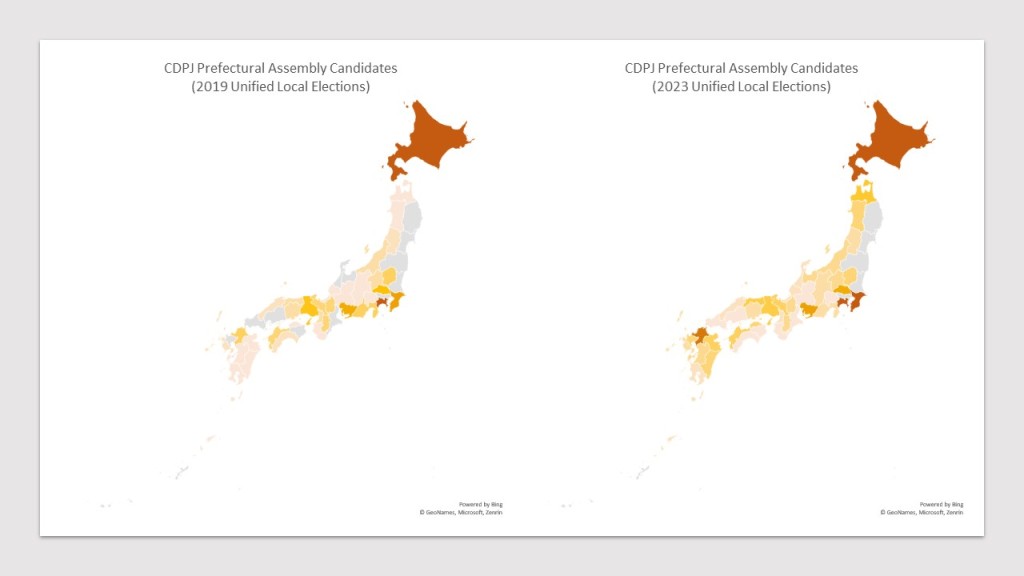
Note: Pink= 1-9 candidates; Yellow=10-19 candidates; Orange=20+ candidates. Grey is no candidates or no prefectural assembly held.

Note: ratio calculated by pooling the official candidates from four opposition political parties: Ishin no Kai, the CDP, the JCP, and the DPFP, and comparing it to the total number of assembly seats available. Light blue is a ratio of between 0 and 0.29; moderate blue is between 0.3 and .69; dark blue is a ratio of over 0.7.

Note: Light blue is an increase of between 0 and 25% in the ratio; moderate blue is between 25% and 100%; dark blue is a doubling or larger of the ratio between 2019 and 2023.
