
Being in Japan right now and seeing the crisis footing of many countries around the world can feel a bit surreal. How can it be that Japan has the number of cases it does, the population density it does, and the government has not until now felt the need to declare a state of emergency or completely shut down its borders? This is especially true if you live in the Kantō area,* where even a reduction of 20 to 30 percent of people on the street or passengers in trains can still seem…crowded.
Of course, (most) members of the public have engaged in ‘behavioural modifications’ and the government has pursued ‘non-pharmaceutical interventions’ (NPIs) such as requesting school closures and the cancellation of big, crowded events. It is easy to wonder, nevertheless, whether self-restraint in terms of going out (ie. the ubiquitous calls for jishuku), physical distancing, avoiding closed, poorly ventilated spaces, engaging in proper ‘cough etiquette’, or other hygeinic measures to avoid contacting or transmitting SARS-CoV-2, are actually having any effect? The recent dramatic uptick in COVID-19 cases in Tokyo would seem to suggest that discipline and vigilance dropped mid-March, and more drastic measures will be needed to avoid overwhelming medical facilities.
Pertinent to this issue of overburdening medical facilities—and possibly a direct outcome of aforementioned ‘behaviour modification’ and NPIs—is the fate of Japan’s influenza season. To look at this, we can use Japan’s Ministry of Health, Labour and Welfare (MHLW) regular in-season influenza tracking reports. Using 5000 fixed ‘sentinel’ medical institutions to track weekly reported cases of influenza, and 500 fixed in-patient core medical facilities to track hospitalizations, the Japanese government can get a good sense of whether the influenza season is tracking better or worse than previous seasons without having to do a comprehensive, nation-wide survey.
And, at the beginning of 2020, it looked like the 2019-2020 influenza season was going to be brutal. It started earlier than usual in September, with 7 times the number of hospitalizations at the core medical facilities than previous two seasons for that month. Hospitalization cases in December were still 3-4 times higher than the previous two seasons. This is something, because influenza-induced deaths have been rapidly trending upwards since 2010 according to MHLW annual statistics. The previous two seasons each resulted in national totals of 3308 deaths (2017-2018) and 3,267 deaths (2018-2019 season) from influenza directly or influenza-induced pneumonia. The 2018 calendar year was the deadliest year since 1970 for influenza fatalities. This year was on track to be even worse.
Then, suddenly, it was not to be.
Weekly observations at the 5000 fixed sentinels never reached the heights of previous seasons. The comparatively very bad December ended up being the peak of this year’s influenza season based on sentinel reports. The figure below taken from MHLW regular influenza reports tracks the peaks and troughs of the respective 2017/18, 2018/19 and 2019/20 influenza seasons. The y-axis is the number of reported cases per sentinel per week, while the x-axis is the week of the year.

A very similar trend can be seen when I collated the monthly totals for hospitalizations at core medical institutions, an arguably more concrete measure of influenza impact.

Like sentinel observations, influenza hospitalizations dramatically dropped after December. While December’s hospitalizations were four times up on the previous season, January had only just over 1/3rd the hospitalizations of the previous January. In February 2020, hospitalizations were 31 percent of the 2018/2019 season, and 19 percent of the 2017/2018 season. March was even kinder, registering 20 percent and 10 percent of hospitalizations, respectively, for influenza compared to previous years. Despite the earlier start to the season, 2019/20 hospitalizations for influenza at the 500 core institutions will register only 2/3rds of the previous two seasons.
To be sure, by the start of 2020 there was already significant concern about how deadly this influenza season was going to be. The MHLW had raised its alert level. Many classes and class years in Japanese schools were being closed to contain influenza. Students were told to dispense with any gaman (perseverance) and to stay home even if they had the slightest influenza symptoms. Then Japan got its first COVID-19 case in mid-January.
Perhaps, I wondered, hospitalizations were driven down by the moderately influenza-afflicted avoiding hospitals or being told to avoid hospitals given the risks of contracting the novel coronavirus? However, when one looks at the ‘serious’ hospitalizations from influenza requiring special care—admission to the ICU, the use of artificial respirators, or the conduct of a CT scan, MRI or EEG—a similar pattern emerges.

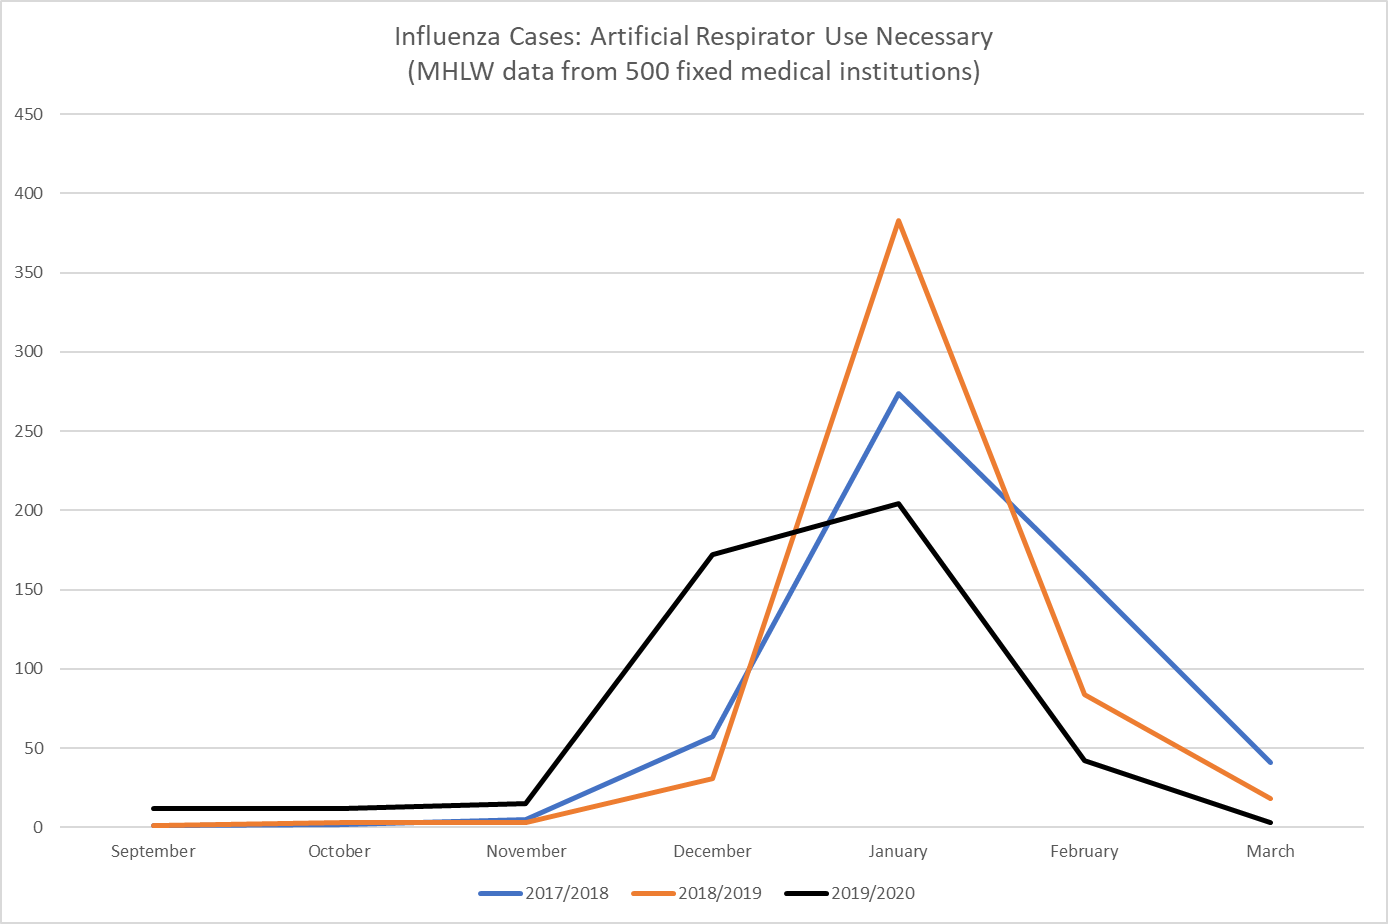

For each of these categories, the December numbers were at least three times higher than those for the 2017/2018 and 2018/2019 seasons. Then, in the new year, the numbers dropped off rapidly. This does not suggest any kind of rationing in favour of serious cases versus moderate cases. From this data, it seems Japan as a whole had one of the lightest influenza seasons for many years with total hospitalizations in the 2019/2020 season coming to 66 percent of the previous season’s total, and hospitalizations requiring special attention coming to approximately 78 percent of the previous season (despite the very high early numbers).
Another Japanese rapid notification system using indicative measures is administered by the National Institute of Infectious Diseases. It uses notifications from 21 major Japanese urban jurisdictions of deaths from influenza and pneumonia. Rather than simply reporting raw numbers, the collated reports are measured against an expected mortality rate baseline modeled on factors including the presence of underlying diseases and the aging of the population. ‘Excess mortality’ from influenza and/or pneumonia takes place when actual deaths exceeds a threshold—defined as the upper limit of the 95% confidence interval for the baseline. The figure below shows that in December 2019, actual influenza-related and pneumonia deaths (blue line) were at the excess mortality threshold (pink). However, by the end of January we start to see a consistent downward trend towards the baseline (green line), and then a big plunge around the start of March as many jurisdictions did not report any deaths.

Regrettably, as can be seen below, Tokyo is letting the team down (again), with reports of excess mortality at the end of the year, and the end of February.
Like the MHLW weekly influenza reports, this data is more indicative rather than complete, and the MHLW statistics yearbook will have the final word on influenza and pneumonia deaths nationwide. From what I can tell, even the 2019 data will not be published until the middle of this year.
Nevertheless, there is good reason to believe that Japan as a whole avoided a high death rate from influenza as the COVID-19 crisis continues to unfold.**
Perhaps the most striking result, however, came from when I broke down the number of hospitalizations into age groups. Unlike COVID-19, influenza and influenza-induced pneumonia are equal opportunity menaces in that both the elderly as well as infants and younger children are likely to be particularly susceptible. Interestingly, if we look at the statistics for hospitalizations, under 60 age cohorts were hospitalized in similar numbers to the previous two years, but hospitalizations of those over 60 were down considerably.

Furthermore, influenza hospitalizations requiring greater attention and care (ICU admission, use of artificial respirators, and the need for various scans) revealed similar year-to-year patterns.


In fact, this year’s influenza looks like the reverse image of COVID-19 in terms of the group it most afflicts. Why is this? I am not really sure, although the answer could be as simple as people being more careful around older people and giving them greater leeway in public (what I’d like to believe), although it is more likely that over 60s were the most ardent practitioners of self-restraint and seldom left home out of fear of COVID-19.
I collated these statistics mainly for my own interest as a proxy indicator of whether behavioural modification was actually taking place in the Kantō region of Japan. Deciding which non-pharmaceutical intervention was the most effective at mercifully cutting short the influenza season is better left to the experts; but whatever it was, given the possibility of much stricter limitations under a state of emergency declaration for the Kantō region, we can take some comfort from the thought that the two months of on-and-off jishuku and other behavioural modifications was not for naught. It is likely many lives have been spared from both COVID-19 and influenza.
*The Kantō region is the Tokyo Metropolitan Government plus the surrounding prefectures. Population of around 40 million people.
**There was also no major increase in the units of influenza vaccines procured in advance for the 2019/2020 season (see this MHLW document, p.3). Since the early part of the season was particularly bad, and younger age groups suffered as much as usual, enhanced vaccine effectiveness for this year is unlikely to be an explanation.
***For those interested, early season reports found Influenza-B to be most common at 59%, the ‘new influenza’ from the 2009 season (AH1pdm09) registered 39%、and Influenza-A (subtype H3N2) was 2%.

This is a great contribution, thanks for it.
Do you have any thoughts on whether yearly variations in vaccine effectiveness might have affected these numbers? The CDC reported American figures for VE in 2018-2019 (29%) and 2017-2018 (38%) that seem quite a bit lower than other recent flu seasons (eg. 2015-2016: 48%; 2013-2014: 52%). If VE is much higher this year, it might explain the better numbers overall (especially among the elderly, who are more diligent about getting their shots), although it wouldn’t explain the sudden drop off after December.
The CDC has very recent data but I can’t interpret it. (I’m also likely misinterpreting the data above, I’m not an expert!)
Ref: https://www.cdc.gov/flu/vaccines-work/past-seasons-estimates.html
Hi Tim, thanks for the kind words greatly appreciated. I had a quick look for anything in Japanese about the issue but nothing stood out that would give any extra insight on the Japanese situation re: VE. I am not an expert either, but from my limited understanding flu vaccines tend to work more by reducing the severity of symptoms rather than preventing illness in the first place (like Measles and Rubella vaccines). So it would have its greatest effect on the numbers of hospitalizations etc. When I look at the month by month hospitalization numbers, however, in the previous two seasons the over 60 age group seems to have similar numbers to the under 10 age group up until basically December. This trend held true for the 2019/20 season also. It is what happens later that is remarkable – for January, February, and March, over 60 numbers about 2-4 times higher than under 10 age group numbers in the late season for 2017/18 and 2018/19. That late season impact didn’t happen at all in 2019/20 and the two groups remained roughly similar through to March in terms of raw hospitalization numbers. If it was a question of VE and greater elderly uptake of vaccinations, I would have expected a different pattern. But that is just a rough look at the numbers.
Another thing to consider is that flu deaths apparently aren’t wildly different in the US this year compared to previous years: https://www.cdc.gov/flu/about/burden/2018-2019.html
The US and Japan use the same vaccines, as far as I know, so if deaths haven’t changed much in the US, but have fallen considerably in Japan, abundant room is left for the possibility that mask usage and self isolation are responsible for the fall in flu deaths that you’ve pointed out. Very heartening news. I hope the media pick this up.
Pingback: Who wins from the Tokyo Olympics going ahead | East Asia Forum
Pingback: Who wins from the Tokyo Olympics going ahead – News of the world
Pingback: Who wins from the Tokyo Olympics going ahead - 51posts